Tech Tips
Power BI - What's It All About?


Power BI Is The Hot Tool Of Business Intelligence
Microsoft have been pushing Power BI for some time now as the tool to use for publishing reports and dashboards that can be accessed by anyone from anywhere at anytime and from any device.
Power BI offers many styles of visualisation to enable business information to be presented in an attractive and informative style. You can present data using charts, tables, cards, KPIs, gauges, maps, funnels and more. The screen shot above shows some of these representing Google Anayltics web site activity.
Power BI can be used to create reports and dashboards from data in a variety of data sources: excel workbooks, text files, databases, cubes, tabular models and also many online and cloud services.
Clicking on More will display the following dialog:
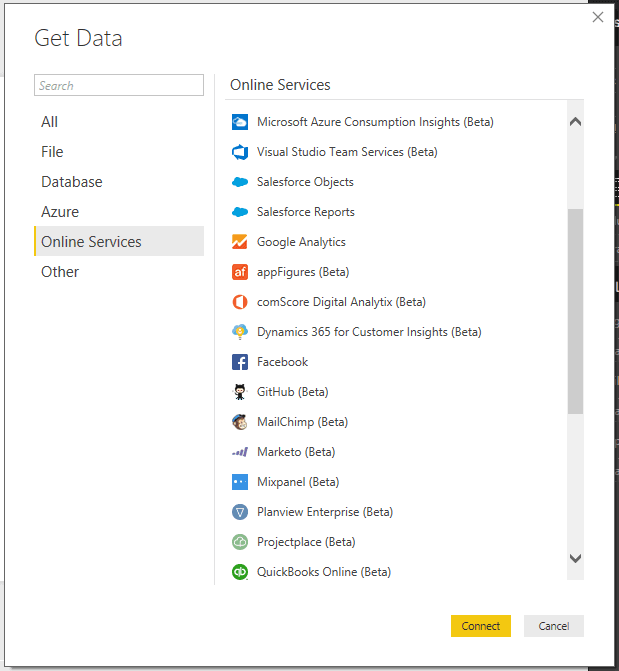
And some of the Online services are shown here:
Share This Post
Mandy Doward
Managing Director
PTR’s owner and Managing Director is a Microsoft MCSE certified Business Intelligence (BI) Consultant, with over 30 years of experience working with data analytics and BI.
Frequently Asked Questions
Couldn’t find the answer you were looking for? Feel free to reach out to us! Our team of experts is here to help.
Contact Us


