Tech Tips
Microsoft Power BI: How to - use the forecasting feature in Power BI
Using the Forecasting Feature in Power BI The forecasting feature in Power BI uses machine learning algorithms to predict future values based on historical data. This helps businesses to make informed decisions, plan for future trends, and adjust strategi


Using the Forecasting Feature in Power BI
PTR is proud to provide Power BI Consultancy Services to help you and your business get the most from your data but when only a quick answer will do, here is the latest in our series of bite-sized “How to” guides for Power BI, looking at how to use the forecasting feature in Power BI.
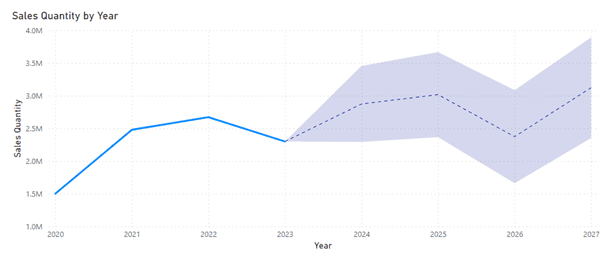
The forecasting feature in Power BI uses machine learning algorithms to predict future values based on historical data. This helps businesses to make informed decisions, plan for future trends, and adjust strategies, leading to increased efficiency, profitability, and customer satisfaction.
By leveraging the power of machine learning and incorporating it into forecasting models, businesses can improve the accuracy of their predictions and create custom forecasting models based on their specific needs.
Additionally, Power BI allows users to adjust the forecast by specifying the confidence interval and smoothing parameter, thereby improving the accuracy of the forecast and providing more reliable insights for decision-making.
So the forecasting feature in Power BI really gives businesses a powerful advantage, helping you stay ahead of the competition, adapt to changing market conditions, and make informed decisions - all based on predictive analytics.
Steps to take when using the forecasting feature in Microsoft Power BI
Import Data: First, import your data into Power BI.
Visualize the Data: Create a visual representation of your data, such as a line chart, that includes a time-based axis.
Enable Forecasting: Select the visual, then expand the Forecast section of the Analytics pane. The forecast option will only be visible if Power BI recognises the data as date or time. It is important to make sure datatypes are assigned correctly, as using string labels will not work with forecasting.
Configure the Forecast: Modify the forecast by specifying inputs such as the Forecast length or the Confidence interval. You can also adjust the forecast line's colour, style, and transparency.
Evaluate and Customize: After the forecast is generated, you can evaluate its results and customize it further based on your specific requirements.
It's important to note that while using the forecasting feature, the ability to use dynamic reference lines is based on the type of visual being used. For example, the forecasting feature is only available for line chart visuals.
Business use cases for forecasting in Microsoft Power BI
Retail: Retail businesses can use the forecasting feature to predict future sales trends, optimize inventory levels, and plan targeted promotions during periods of anticipated high demand..Manufacturing: Manufacturing firms can utilize the feature to predict demand accurately, leading to improved production planning and resource allocation
Government: Government departments like health can use Power BI forecasting to predict patient admission rates, enabling hospitals to optimize resource allocation like staffing, bed availability, medical supplies or equipment, allowing for better inventory management. Or it could be used to anticipate public health trends, like the spread of diseases, to plan preventive measures.
Finance: Financial institutions can leverage the feature to forecast market trends, manage investment portfolios, and make informed decisions based on predictive analytics
Logistics and Supply Chain: Businesses in logistics and supply chain management can benefit from accurate demand forecasting to optimize resource allocation, stock management, and cost efficiency
To get more pointers, short cuts and answers on how to get the most from your data visit how to create Power BI reports and dashboards.
Get the most from your Power BI - arrange your data and prepare for powerful visualizations. Friendly and knowledgeable PTR experts are always available for Power BI consultancy services and Power BI training if you have any further questions. Enquire Now.
We offer a blended consultancy and training approach to helping you with your Power BI Data Journey: Microsoft Azure BI Solutions Training, Data Strategy Consulting, Data Analytics Consulting, Power BI consulting and Microsoft Fabric Consulting and that’s just for starters. Please contact us for your bespoke training course.
Please contact info@ptr.co.uk to find out how we can help you.
Share This Post
Stephanie Butchart
Senior Business Intelligence Consultant
An MCSA-certified BI Consultant with 8 years' experience, Stephanie is proficient and knowledgeable across Microsoft technologies with a full range of platforms - from traditional on-premise data warehousing through to Azure BI solutions and Power BI.
Frequently Asked Questions
Couldn’t find the answer you were looking for? Feel free to reach out to us! Our team of experts is here to help.
Contact Us


